
Muppet Analytics 101
How you shape company culture will wholly depend on who you hire. And the big question is: Do you want to hire Chaotic Muppets or Order Muppets?
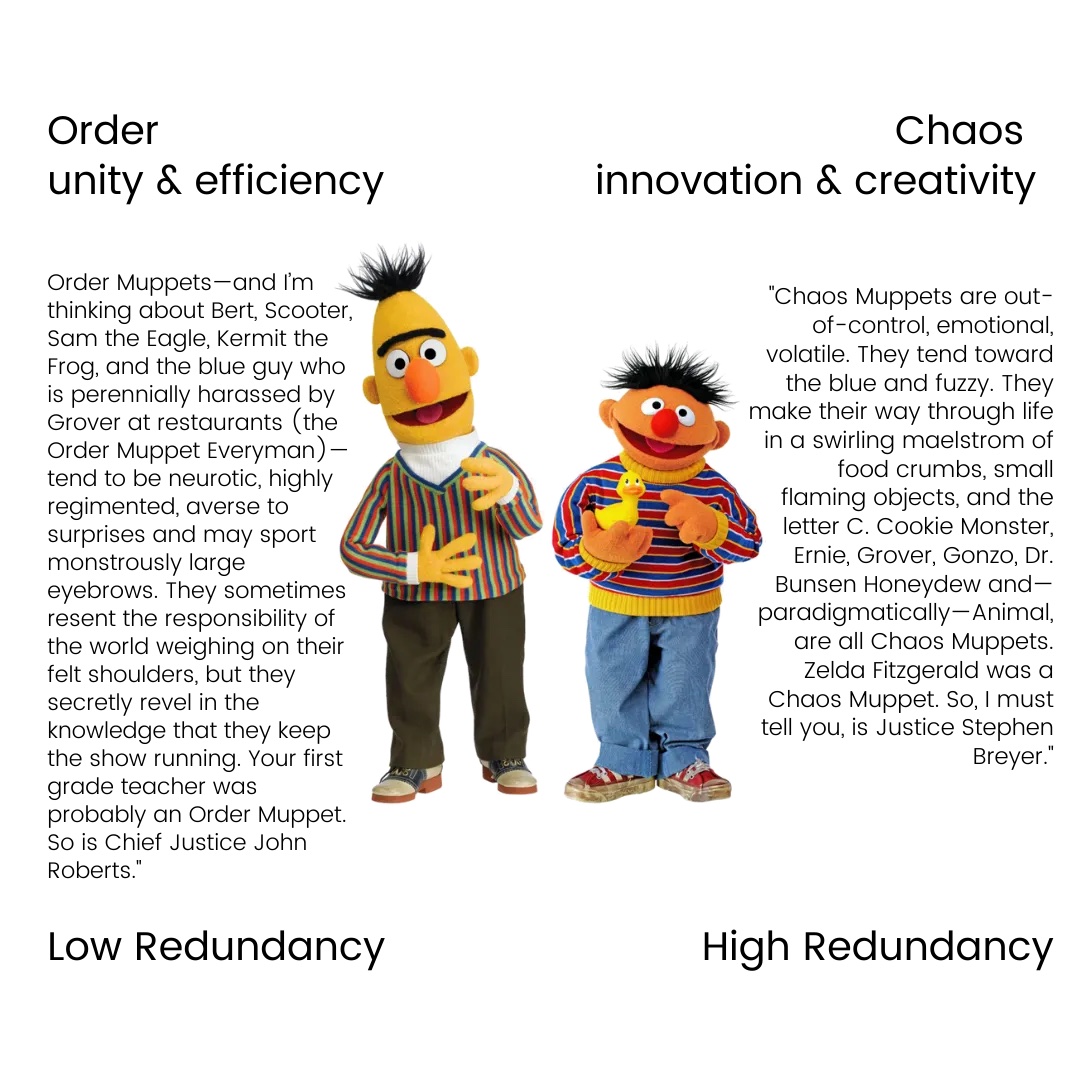
Back in 2012 Dahlia Lithwick wrote an article for Slate outlining how most of us can be classified as two types of people: Chaos Muppets and Order Muppets. Are you Kermit the Frog or Miss Piggy? Gonzo or Sam the Eagle? This theory came about in her work observing the productivity of the US Supreme Court.
Muppet Theory: a little-known, poorly understood philosophy that holds that every living human can be classified according to one simple metric: Every one of us is either a Chaos Muppet or an Order Muppet. — Litchwich
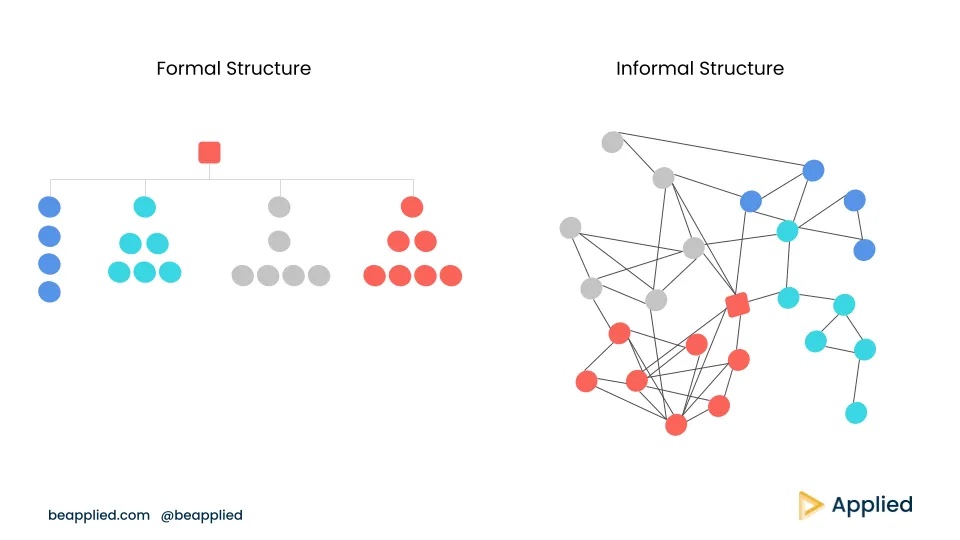
People underestimate how much employees influence company culture and how it’s built over time. Company culture is shaped informally and formally through networks of people. Obviously, there are structures in place that help shape it — like org charts, incentives, values, tools, and processes but those too are informed by the people that create them. While the two aren’t directly linked there are some very strong ties between the Muppet Chaos theory and Organisational (informal) Network Analysis. This is to say, that most people fit into a type: chaos (creative) and order (efficient). In this blog, I’ll walk you through how we can understand the balance between the two with People Analytics and Network Analysis, why it’s a worthwhile pursuit, and how we can build diverse and inclusive teams.
People Analytics is the use of statistical data analysis from all the tools and infrastructure that we use to help inform people decisions and ultimately business strategy.
Organisational (informal) Network Analysis gathers information through surveys, emails, meeting room attendees/times etc to create a map of the formal and informal relationships and communication channels that happen at work.
Even though there are lots of ways that societies are moving away from binary structures, humans still have a great drive to fit things into neat little boxes. So, while all you beautiful humans contain multitudes and probably don’t fit into a neat little box, for the purposes of this article, I’m going to put you into one.
Are you Bert or are you Ernie?
Dahlia Lithwick put this to readers simply by showing a Sesame Street episode with Bert and Ernie and asking are you the type of person that will get crumbs in the bed or not?
What Connections do Bert and Ernie have? More and more companies are using sophisticated software like Culture Amp, Socilyzer, Leapsome, Slack, Scales, and even Applied to take account of how they build and engage with their teams. With better data collection and analysis we can measure this fairly accurately using Informal Network Analysis. Most businesses are networked and their teams are interdependent. They rely heavily on those around them to collaborate both formally and informally to get work done. For example, when hiring for a new role in Applied you might ask people from outside your team to be reviewers and even interviewers.
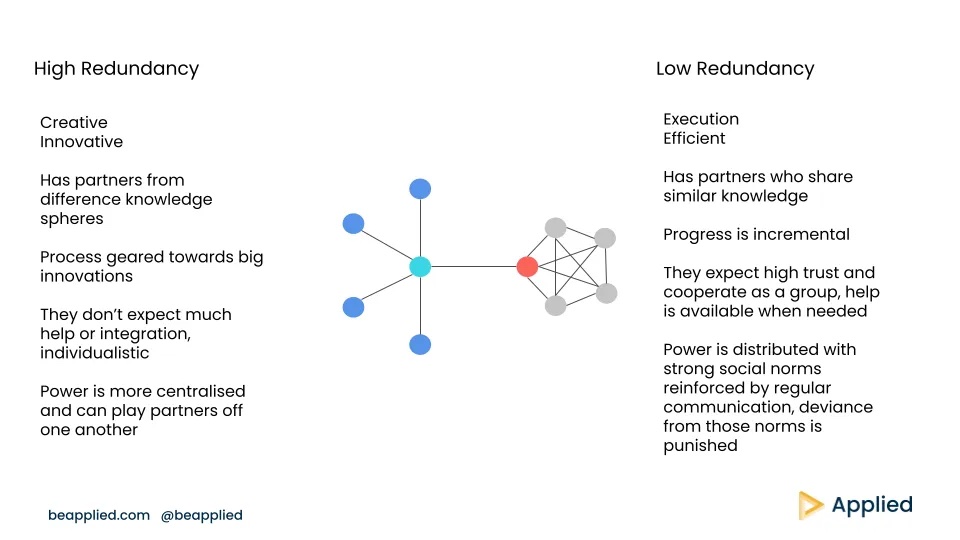
In network analysis, we look at degree centrality — the number of ties that you have and how open and closed they are. Open networks are connections where there are fewer ties between the people someone has ties to; this is known as high redundancy. Closed networks are those where there are more ties between the people someone has connections to; this is known as low redundancy. In looking at degree centrality, we can analyze what kind of information people have access to, their influence, their visibility, and ultimately what support they give and receive in the company.
People with Low Redundancy degree centrality would fall under the Order Muppet category and High Redundancy would fall under the Chaos Muppet category. Descriptions are relatively in line with Lithwick’s from Slate above:
To do this sort of analysis at your company you could look at the number of inbound and outbound emails or slack messages from individuals (only the inbound/outbound data, I’d hold off on anything re. content!!), meeting attendees, or how often people are in proximity to one another (like desk bookings).
A better first port of call is to do a network survey of the company asking people who they speak to most about x topic or who they trust the most or who they believe to be a leader regardless of their title. When doing this, it’s important to know what you are going to ask about:
- Directed ties: A → B ≠ B → A eg. advice seeking, friendship, email
- Undirected ties: A → B = B → A eg. co-participation, project, document and information sharing
- Binary ties: does this tie exist or not? eg. did you work with this person on x
- Weighted Ties: continuous and varies in length eg. how frequently do you communicate with x person?
Building Diverse, Inclusive, and Data Literate Teams
So, why is network analysis important to building diverse teams? Lithwick notes:
“It’s simply the case that the key to a happy marriage, a well-functioning family, and a productive place of work lies in carefully calibrating the ratio of Chaos Muppets to Order Muppets within any closed system….Remember the old rule of thumb: Too many Order Muppets means no cookies for anyone.”
We know that organically built diverse teams are more creative and more productive. We can’t conduct network analysis with just one individual — it’s something that needs to be analyzed as a whole. Although we can get insights into an individual’s connections, it isn’t the purpose of doing this analysis. Networks change over time and the whole point in doing this sort of analysis is to assess how a group of people connect and are those connections positive and productive. So, if we are looking beyond hiring, we need to assess how we can build inclusive teams, not just diverse ones.
We should look to and invest in People Operations teams and People Analysts to lead the way for smarter, data-driven, and more strategic team building (and therefore company) initiatives. They are the ones who will best place to look at engagement through surveys and reviews. They will have a good idea if an L&D or Management program is needed, or if doing a cross collaboration project or a cross collaborative OKR might help break up some of the siloes. These are the people in your company who have their ears to the ground and are most aware of the frictions and bottlenecks and can pull the levers to create the most appropriate solutions. These diagnostic tools enable People Operation leaders to create interventions so that people aren’t excluded, promotions aren’t handed out like candy, and silos are prevented.
According to AIHR only 4 in 10 HR professionals can read, apply, and communicate data to inform and support decision making. While the expectation isn’t for People Operations teams to all become data scientists, there does need to be a shift in our approach to what these People Operations Teams can do to build and shape companies in a data driven way.
Check your culture bias
We see binaries in other disciplines and how they affect inclusivity. In an episode of Freakonomics, they explored the theory of tightness and looseness with one of Stanford’s Sociology Professors, Michelle Gelfand, and how a country’s culture can shape our minds and bodies. ‘Loose’ equates to the creative and innovative Chaos Muppets and ‘tight’ cultures equate to the efficient and compliant Order Muppets. Loose cultures tend to be more liberal, but they also tend to lack self control. Loose countries have higher rates of obesity, drug and alcohol abuse, and violence. While Tight countries have more norms and rules, they also have less jaywalking and litter. Areas that have a higher threat level will be tighter, this includes threats like natural disasters, war, or terrorism. This can be tested on individuals through what is known as the Ash Conformity Test. It tests people on their willingness to conform to a group. 1/3 of Americans (what is considered a loose country) conform to the test, whereas people in collectivist countries like Japan and Zimbabwe, conform with much higher rates of conformity.
You are probably thinking you are an Order Muppet when in reality you are probably a Chaos Muppet. A word of caution: It’s incredibly hard to self-diagnose, much in the same way it is difficult to diagnose others as an INTJ or an ENPF without using some subjective judgment or data. If you’ve read Noise by Daniel Kahneman the jazz playing accountant is a perfect example of our inability to make good judgments If you start thinking about all of the Chaos Muppets in your life and have no data to hand, you might start to think of all the women you know — and that’s a real problem. We live with the burden of gendered literature and pop culture, where order and chaos are often depicted through a female/male binary. In the bible it’s Adam and Eve, in Greek mythology, it’s Gaia and Uranus. In a world where women are often depicted as hysterical, emotional, and unstable, It creates troubling stereotypes that can have real world effects. In tighter cultures, women end up worse off than their counterparts if they slip up. When women and people with ethnic minority backgrounds breach norms or rules in those cultures (like coming into work late), they are often subject to higher punishment.
These Three Approaches Are Not the Same.
It’s important to note that I’m conflating here a bit about three very different things (Lithwick, Gelfand, and network analysis) but it paints an interesting through-line that’s useful for reflecting on your company’s culture. As many startups and scale-ups are hiring more globally and therefore from many different cultures that are “tight” and “loose,” using data will help mitigate some of these biases when building diverse and inclusive teams. They’ll also help you determine if you are spending a bit too much time on the creative side not getting enough things done or if you are getting things done but not being very innovative.
Let’s be real, we all want to be both and that is why using data is crucial to getting the balance right.